-
cPanel
-
- Mailing Lists
- Default Address
- Autoresponders
- Forwarders
- Email Accounts
- Spam Filters
- Track Delivery
- Global Email Filters
- Email Filters
- Address Importer
- Encryption
- Email Disk Usage
- Calendar Delegation
- BoxTrapper
- Configure Greylisting
- Email Routing
- Filter Incoming Emails by Domain
- Email Deliverability
- Authentication (SPF and DKIM)
- Show Remaining Articles (4) Collapse Articles
-
-
WHM
-
- SSH Password Authorization Tweak
- Apache mod_userdir Tweak
- SMTP Restrictions
- Compiler Access
- Configure Security Policies
- Password Strength Configuration
- cPHulk Brute Force Protection
- Security Questions
- Manage External Authentications
- Two-Factor Authentication
- ModSecurity™ Vendors
- ModSecurity Configuration
- Manage root’s SSH Keys
- Manage Wheel Group Users
- Host Access Control
-
- Terminate Accounts
- Quota Modification
- Modify an Account
- Change Site’s IP Address
- Create a New Account
- Manage Account Suspension
- Upgrade/Downgrade an Account
- Limit Bandwidth Usage
- Force Password Change
- Email All Users
- Reset Account Bandwidth Limit
- Password Modification
- Skeleton Directory
- Rearrange an Account
- Raw Apache Log Download
- Modify/Upgrade Multiple Accounts
- Web Template Editor
- Unsuspend Bandwidth Exceeders
- Show Remaining Articles (3) Collapse Articles
-
- Articles coming soon
-
- Articles coming soon
Daily Process Log
Step 1: Log into your WHM >>Server Status >>Daily Process Log
Step 2: From the upper left, type into the search box, Server Status. In the options listed, there will be Daily Process Log.
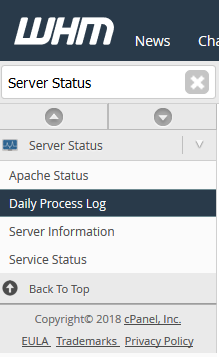
Step 3: Select Daily Process Log, and it will take you to a page where you can see more information about the processes that would run and the resources they use with cPanel / WHM.
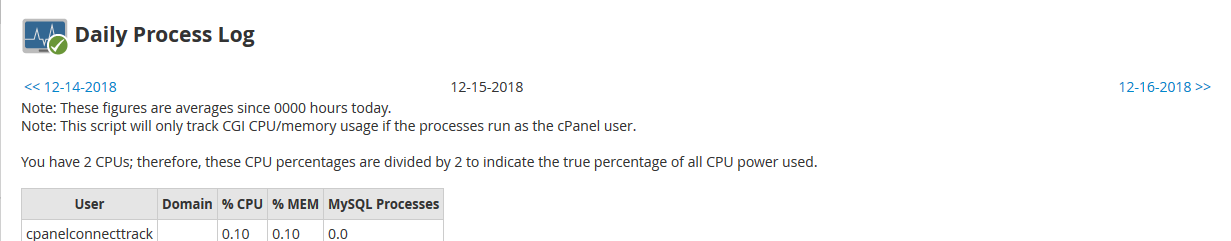
Viewing The User List
On the Daily Process Log page, the first chart at the top will show a list of users on the server and the average resources that have been used by the user.
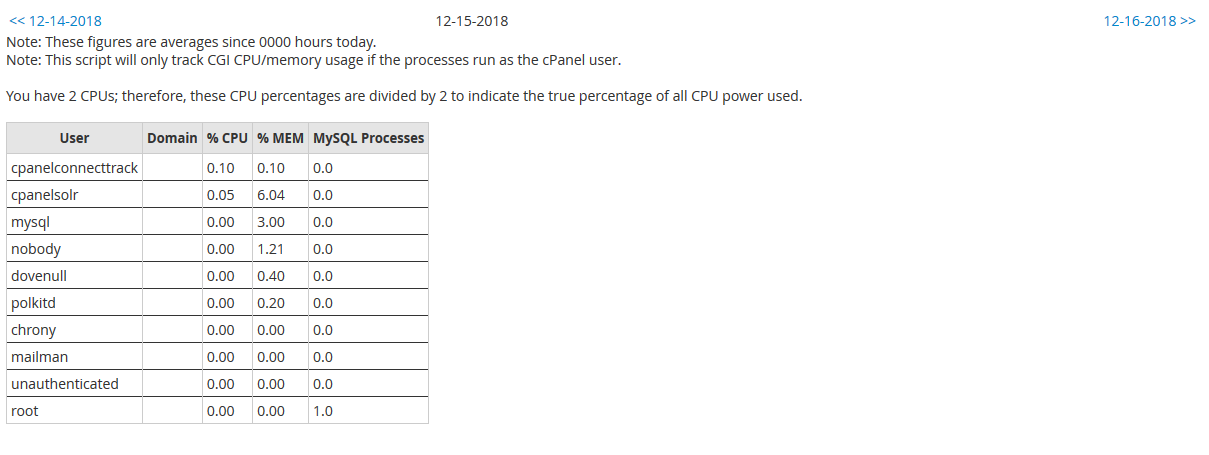
There will be several columns of information. Each can be used to identify the resource usage of the particular user.
- User – This is the user on the server that was tracked through cPanel.
- Domain – If the user is a cPanel account, the primary domain for the cPanel user will be displayed here. If it is a system account, this column will be blank.
- % CPU – This will list the Daily Average CPU Percentage that the user has used. These values will be divided by the number of CPU Cores that your server has to represent what has been used accurately.
- % MEM – This is the daily average percentage of Physical Memory (RAM) that has been used by the user on Average.
- MySQL Processes – The average MySQL Processes that have been used for this user daily.
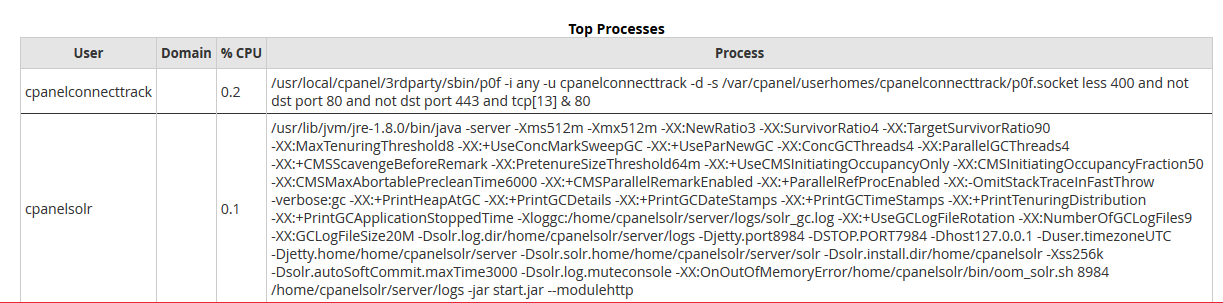
Top Processes List
The next chart further down the page will show the Top Processes that have been run on the server. This is particularly helpful in seeing what has caused the highest Resource usage on the server in the last day.