
CloudLinux Manager
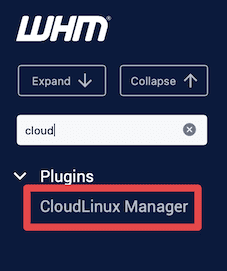
Log in to your whm>> Server Configuration>>CloudLinux Manager
Begin by logging on to WHM.
Find CloudLinux Manager in the menu to the left.
You will now see a main menu with several options/pages, which we’ll go through below.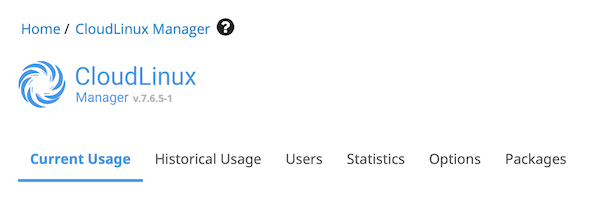
Current Usage
This page shows which of your cPanel accounts that are using system resources at the moment. You will also see how much resources they use currently. The different columns should be interpreted like this:
LVE ID: The cPanel username. Hover over the username to see more information about the user.
SPEED: How much CPU that’s being used. 100% = 1 core.
MEM: How much RAM that’s being used.
IO: How much data that is being read and written to the storage.
IOPS: How many read and write operations to and from the storage taking place per second.
PNO: The total number of processes running under the account.
EP: Number of Entry Processes, i.e. processes that has been started by e.g. a request to Litespeed (this could be due to a website visitor).
Actions: Click the pen to edit the limits for the user.
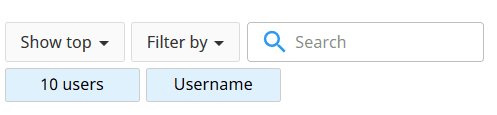
If you’re looking for a specific account you can use the search bar just above the list. You can also limit the number of accounts viewed and change so you see the main domain instead of the cPanel username.
 Historical
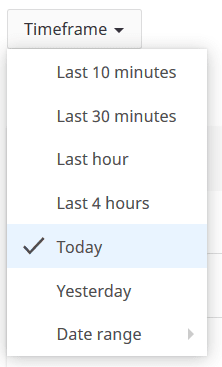
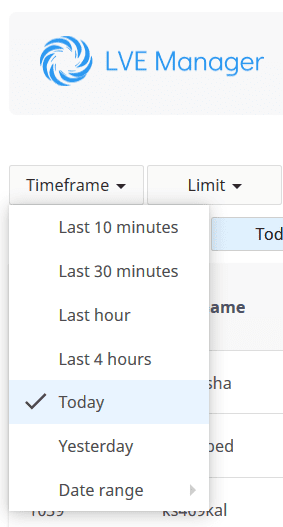
UsageHere you can see information about how much resources all your cPanel accounts has been using in total. First, select the Timeframe you wish to view.
Further down on the page you will see several graphs showing the usage for the selected timeframe. By analysing these graphs you can decide if you need to upgrade your service.

Below the graphs you can see a table showing the top five accounts that has used resources during the chosen timeframe.
To see more information about which account that is responsible for the greatest system resource usage, you need to check under Statistics.
Users
Here you can see a list of all cPanel accounts you’ve created.
If you click the pen icon to the right of an account (under Actions), you can edit the amount of resources the specific account has available. These settings will overwrite the ones set for the package that the account uses.
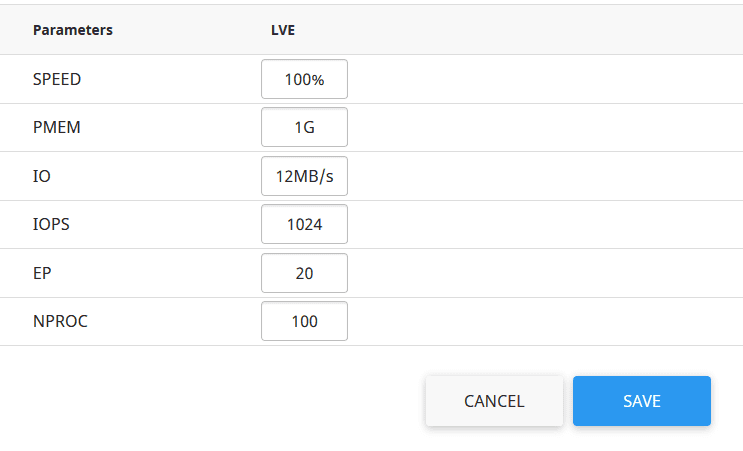
The various settings implies the following:
SPEED: Number of CPU cores, 100% = 1 core.
PMEM: RAM.
IO: The speed with which the account is allowed to read and write to the storage.
IOPS: The number of read and write operations allowed per second.
EP: Number of Entry Processes, i.e. processes that has been started by e.g. a request to Litespeed (this could be due to a website visitor).
NPROC: The maximum number of processes the account is allowed to run. Should always be higher than the number entered under EP.
If you instead click the clock icon under Actions (rather than the pen one mentioned above), you will be presented with information about historic resource usage for the specific account.Statistics
Here you can see an overview of the resource usage for your accounts, and identify problematic accounts.
First, select the timeframe you wish to view. You do this towards the top left.
Then, you can click the different table headers to sort on the clicked category. E.g. if you want to find accounts that have maxed out their CPU usage, click the F under SPEED.
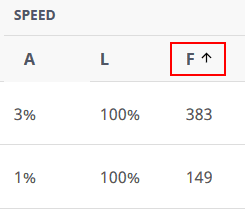
In this case, a few accounts have hit the limit a number of times. To see more statistics about a specific account, click the graph icon to the right of the account.
The same principle is applicable to the other categories you might want to check. The various headlines and abbreviations implies the following:
SPEED: CPU usage, 100% = 1 core.
PMEM: RAM usage.
IO: The speed with which the account is allowed to read and write to the storage.
EP: Number of Entry Processes, i.e. processes that has been started by e.g. a request to Litespeed (this could be due to a website visitor).
NPROC: The total number of processes the account ran.
IOPS: The number of read and write operations per second.
A: Average usage for the chosen timeframe.
L: The maximum limit for usage.
F: Number of faults that occurred during the chosen timeframe.
Options
On this page you can activate notifications to yourself as a reseller and/or to your clients if limits are reached.
LVE Faults Email Notifications
Here you have three options:
Notify me on users faults: If a client hits a limit, you will receiven an email.
Notify Customers: If a client hits a limit, the client will receive an email.
Notify me when I hit my limits: If your reseller account reaches a limit, send an email to yourself.
Faults to include
A notification will be generated when a fault occurs, here you can make selections regarding what generates a fault:
SPEED: If the CPU limit has been exceeded.
IO: If the read/write limit is exceeded.
IOPS: If the number of read/write operations per second is exceeded.
Memory: If the limit of allowed RAM usage is surpassed.
Concurrent connections: If the maximum number of EP has been reached.
NPROC: If the maximum of allowed simultaneous processes has been exceeded.
Minimum number of Faults to notify
Here you can choose how many faults that are required for a notification email to be generated. E.g. if a cPanel account reaches the limit for RAM usage once, one fault will be generated. If you’ve set the notification limit to two, no notification will be sent out. If you, on the other hand, have set the limit to one, a notification email will be sent.
You have separate settings regarding the number of faults which will generate notifications that should be sent to your client and which ones should be sent to yourself.
You also have the option to set intervals for how often notification emails should be sent out, so no one gets spammed if a cPanel account exceeds its limits for an extended period of time.
Packages
Here you can see the different packages you’ve created via WHM, and edit how much resources that should be included in each of them. If you don’t know what a package is or how you create one, please refer to this guide first.
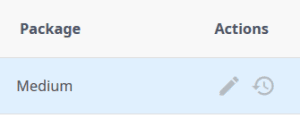
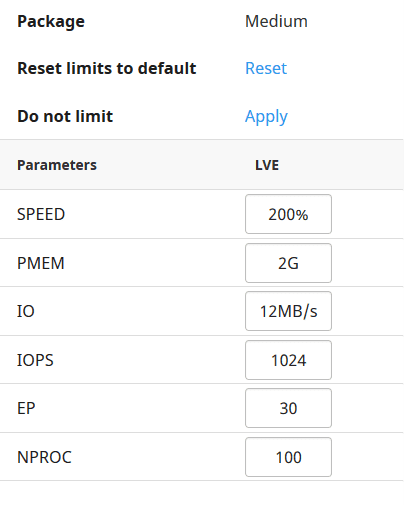
If you click the pen icon to the right of each package, you may edit the settings for that specific package. The different settings imply the following:
SPEED: The number CPU cores the account is allowed to use. You enter it as percent of a core, so to assign two cores, enter 200 in the field.
PMEM: The total amount of RAM available for the account. You enter it in GB.
IO: Maximum read- and write speed to the storage allowed for the account.
IOPS: Maximum number of reads and writes to the storage allowed per second.
EP: One Entry process is a process created on the server, e.g. from a request from Litespeed due to a visit to a website. This specifies the maximum number of simultaneous such processes that are allowed.
NPROC: Maximum number of processes that the account is allowed to runt at once. This number should be higher than the one entered under EP (above).
Each cPanel account using the package you edit will get the updated resources. As long as you haven’t overwritten the resources for a specific account (which you can do under the Users tab), the new limits will apply.