How Can We Help?
-
cPanel
-
- Mailing Lists
- Default Address
- Autoresponders
- Forwarders
- Email Accounts
- Spam Filters
- Track Delivery
- Global Email Filters
- Email Filters
- Address Importer
- Encryption
- Email Disk Usage
- Calendar Delegation
- BoxTrapper
- Configure Greylisting
- Email Routing
- Filter Incoming Emails by Domain
- Email Deliverability
- Authentication (SPF and DKIM)
- Show Remaining Articles (4) Collapse Articles
-
-
WHM
-
- SSH Password Authorization Tweak
- Apache mod_userdir Tweak
- SMTP Restrictions
- Compiler Access
- Configure Security Policies
- Password Strength Configuration
- cPHulk Brute Force Protection
- Security Questions
- Manage External Authentications
- Two-Factor Authentication
- ModSecurity™ Vendors
- ModSecurity Configuration
- Manage root’s SSH Keys
- Manage Wheel Group Users
- Host Access Control
-
- Terminate Accounts
- Quota Modification
- Modify an Account
- Change Site’s IP Address
- Create a New Account
- Manage Account Suspension
- Upgrade/Downgrade an Account
- Limit Bandwidth Usage
- Force Password Change
- Email All Users
- Reset Account Bandwidth Limit
- Password Modification
- Skeleton Directory
- Rearrange an Account
- Raw Apache Log Download
- Modify/Upgrade Multiple Accounts
- Web Template Editor
- Unsuspend Bandwidth Exceeders
- Show Remaining Articles (3) Collapse Articles
-
- Articles coming soon
-
- Articles coming soon
< All Topics
Print
Apache Status
Posted
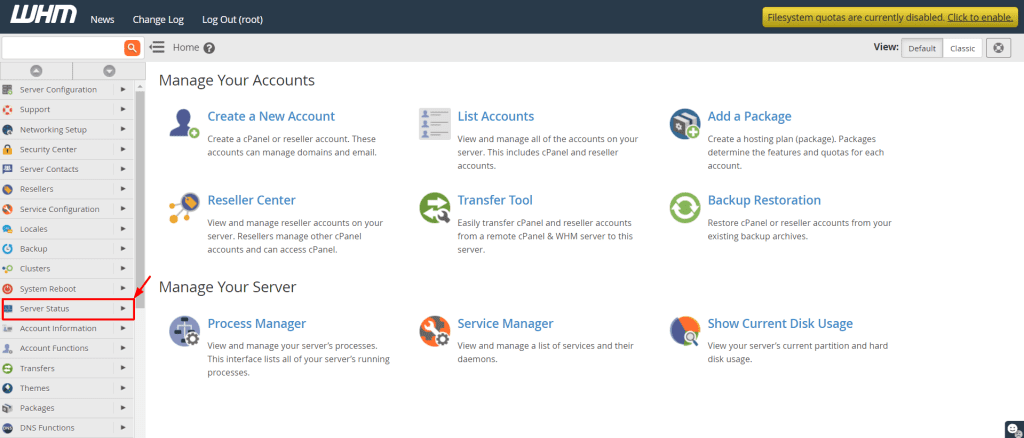
- Log in to WHM >> Server Status >>Apache Status
- Select the Server Statusoption from the navigation menu.

- Click on Apache Status.

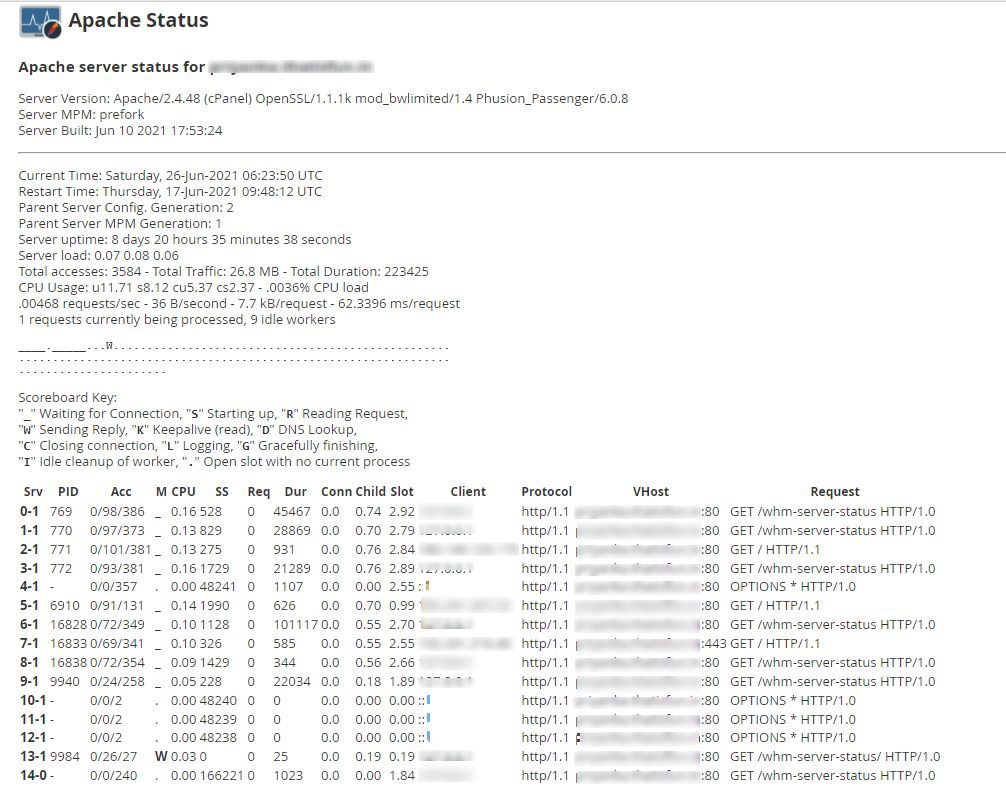
- A log file of the system will appear.

It will have all the details of the server’s current status:
- Server Version– The Apache version, running on the server at present.
- Server Built– The time and date of Apache’s installation.
- Current Time
- Restart Time– The time and date when you last restarted the server.
- Parent Server Generation– The number of times you have restarted Apache to make it re-read its configuration file.
- Server Uptime– The total time for which the server has continued running.
- Total Accesses– The total number of requests for your server from the client-end.
- Total Traffic– The amount of web traffic your server gets in Megabytes (MB).
- CPU Usage– The total CPU usage and current load percentage.
Next, there is a Scoreboard displaying various information regarding the processes the Apache Server has carried out.


